NCAA DI editorial coverage is proudly sponsored by Adidas. Visit All-American Swim for more information on our sponsor. For all the latest coverage, check out our event coverage page.

USA Swimming’s Stats Department has been hard at work parsing the numbers for both the men’s and women’s NCAA Division I Championships.
According to some great information produced by USA Swimming, California looks to be the early favorite when scoring out the psych sheet.
California is slated to have a close meet into the fourth day before pulling away from Virginia and Stanford down the stretch. Stanford is also projected to move ahead of Virginia by the end of the meet with Georgia and Southern California rounding out the top five.
Of course, these are all based on the psych sheet. Lots of movement against seeds will happen at the 2016 NCAA Division I Women’s Championships, but this is some impressive statistical work.
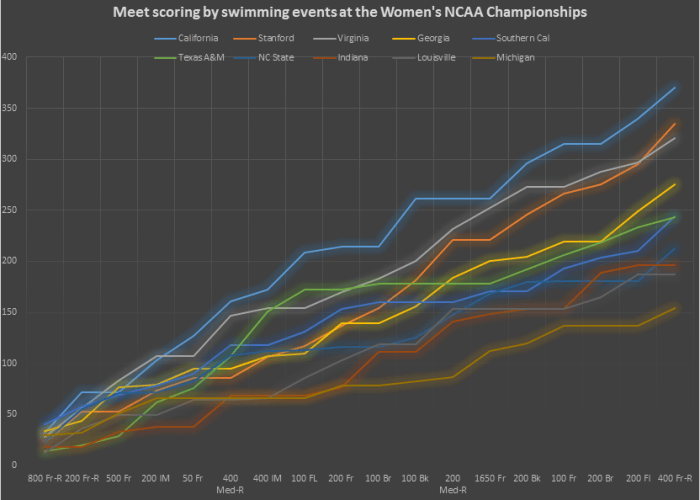
Photo Courtesy: USA Swimming Stats
Full Points Projection
| IND PTS | REL PTS | TOT PTS | ||||
| 1 | California | 234 | 63.2% | 136 | 36.8% | 370 |
| 2 | Stanford | 202 | 60.3% | 133 | 39.7% | 335 |
| 3 | Virginia | 169 | 52.6% | 152 | 47.4% | 321 |
| 4 | Georgia | 177 | 64.4% | 98 | 35.6% | 275 |
| 5 | Southern Cali | 124 | 50.8% | 120 | 49.2% | 244 |
| 6 | Texas A&M | 181.5 | 74.5% | 62 | 25.5% | 243.5 |
| 7 | NC State | 77.5 | 36.5% | 135 | 63.5% | 212.5 |
| 8 | Indiana | 118 | 60.2% | 78 | 39.8% | 196 |
| 9 | Louisville | 117 | 60.0% | 78 | 40.0% | 195 |
| 10 | Michigan | 100.5 | 65.0% | 54 | 35.0% | 154.5 |
| 11 | Tennessee | 60 | 41.1% | 86 | 58.9% | 146 |
| 12 | Texas | 64 | 48.5% | 68 | 51.5% | 132 |
| 13 | Ohio St | 72 | 70.6% | 30 | 29.4% | 102 |
| 14 | Missouri | 41 | 46.1% | 48 | 53.9% | 89 |
| 15 | Arizona | 13 | 16.5% | 66 | 83.5% | 79 |
| 16 | UNC | 24 | 31.6% | 52 | 68.4% | 76 |
| 17 | Florida | 46 | 62.2% | 28 | 37.8% | 74 |
| 18 | Purdue | 39 | 100.0% | 0 | 0.0% | 39 |
| 19 | UCLA | 20 | 62.5% | 12 | 37.5% | 32 |
| 20 | Auburn | 1 | 3.2% | 30 | 96.8% | 31 |
| 21 | Alabama | 12 | 54.5% | 10 | 45.5% | 22 |
| 21 | Boise St | 0 | 0.0% | 22 | 100.0% | 22 |
| 23 | LSU | 11 | 52.4% | 10 | 47.6% | 21 |
| 24 | Virginia Tech | 20.5 | 100.0% | 0 | 0.0% | 20.5 |
| 25 | Kentucky | 14 | 70.0% | 6 | 30.0% | 20 |
| 26 | Florida Gulf | 3 | 17.6% | 14 | 82.4% | 17 |
| 26 | UMBC (W) | 17 | 100.0% | 0 | 0.0% | 17 |
| 28 | Minnesota | 4 | 28.6% | 10 | 71.4% | 14 |
| 28 | Wisconsin | 6 | 42.9% | 8 | 57.1% | 14 |
| 30 | Cincinnati | 12 | 100.0% | 0 | 0.0% | 12 |
| 31 | Air Force (W) | 9 | 100.0% | 0 | 0.0% | 9 |
| 31 | Iowa | 9 | 100.0% | 0 | 0.0% | 9 |
| 33 | Penn St | 4 | 50.0% | 4 | 50.0% | 8 |
| 34 | SMU | 6 | 100.0% | 0 | 0.0% | 6 |
| 35 | Denver | 3 | 100.0% | 0 | 0.0% | 3 |
| 36 | Eastern Mich | 2 | 100.0% | 0 | 0.0% | 2 |
| 37 | Oregon St | 1 | 100.0% | 0 | 0.0% | 1 |
Points By Class For Projected Top 10
| IND EVENTS | FR | SO | JR | SR | Total | |||||
| 1 | California PTS | 82 | 35.0% | 27 | 11.5% | 61 | 26.1% | 64 | 27.4% | 234 |
| California IND | 2 | 25.0% | 1 | 12.5% | 2 | 25.0% | 3 | 37.5% | 8 | |
| 2 | Stanford PTS | 57 | 28.2% | 66 | 32.7% | 53 | 26.2% | 26 | 12.9% | 202 |
| Stanford IND | 1 | 16.7% | 3 | 50.0% | 1 | 16.7% | 1 | 16.7% | 6 | |
| 3 | Virginia PTS | 1 | 0.6% | 0 | 0.0% | 113 | 66.9% | 55 | 32.5% | 169 |
| Virginia IND | 1 | 16.7% | 0 | 0.0% | 3 | 50.0% | 2 | 33.3% | 6 | |
| 4 | Georgia PTS | 0 | 0.0% | 28.5 | 16.1% | 56.5 | 31.9% | 92 | 52.0% | 177 |
| Georgia IND | 0 | 0.0% | 3 | 42.9% | 2 | 28.6% | 2 | 28.6% | 7 | |
| 5 | Southern Cali PTS | 71 | 57.3% | 0 | 0.0% | 40 | 32.3% | 13 | 10.5% | 124 |
| Southern Cali IND | 4 | 57.1% | 0 | 0.0% | 2 | 28.6% | 1 | 14.3% | 7 | |
| 6 | Texas A&M PTS | 24 | 13.2% | 118.5 | 65.3% | 39 | 21.5% | 0 | 0.0% | 181.5 |
| Texas A&M IND | 1 | 14.3% | 5 | 71.4% | 1 | 14.3% | 0 | 0.0% | 7 | |
| 7 | NC State PTS | 0 | 0.0% | 31 | 40.0% | 35.5 | 45.8% | 11 | 14.2% | 77.5 |
| NC State IND | 0 | 0.0% | 1 | 25.0% | 2 | 50.0% | 1 | 25.0% | 4 | |
| 8 | Indiana PTS | 75 | 63.6% | 5 | 4.2% | 7 | 5.9% | 31 | 26.3% | 118 |
| Indiana IND | 2 | 40.0% | 1 | 20.0% | 1 | 20.0% | 1 | 20.0% | 5 | |
| 9 | Louisville PTS | 32 | 27.4% | 2 | 1.7% | 28 | 23.9% | 55 | 47.0% | 117 |
| Louisville IND | 2 | 40.0% | 1 | 20.0% | 1 | 20.0% | 1 | 20.0% | 5 | |
| 10 | Michigan PTS | 67.5 | 67.2% | 24 | 23.9% | 0 | 0.0% | 9 | 9.0% | 100.5 |
| Michigan IND | 2 | 40.0% | 2 | 40.0% | 0 | 0.0% | 1 | 20.0% | 5 |
Additionally, here’s a look at what it took to get invited to NCAAs in the past nine years.
I suggest that you recheck your numbers – individual points shown check out fine but something is goofed up with the relay scoring.
This is what I get for relays for top 7:
173 Stanford
164 Cal
144 UVA
140 USC
115 NC St
110 L’ville
102 UGA